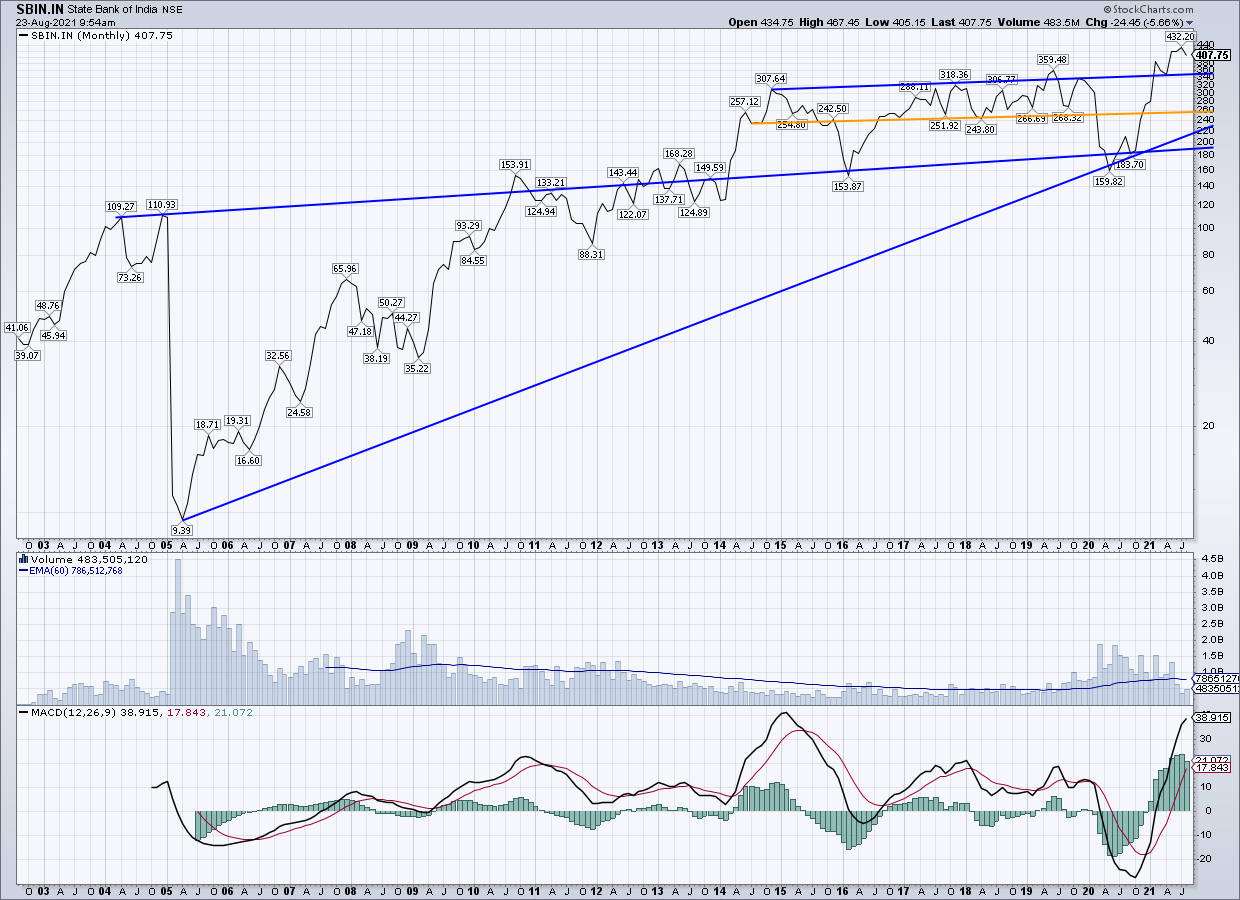
Have a look at the following long term SBI chart.
The stock after testing it’s long term support in March-April 2020 has recently broken out of 2015 highs.
The long term pattern has all classic formations to suggest a sustained upward move for medium to long term investors.
If the market corrects, the stock can provide good entry opportunity at around 340-360 levels. Even otherwise, long term investors can gradually look to accumulate.
Link to a related inves4 note –

